Since infographics are so popular now, it makes sense to use graphs to communicate simple concepts in which most everyone can understand (thanks to truthfacts.com)
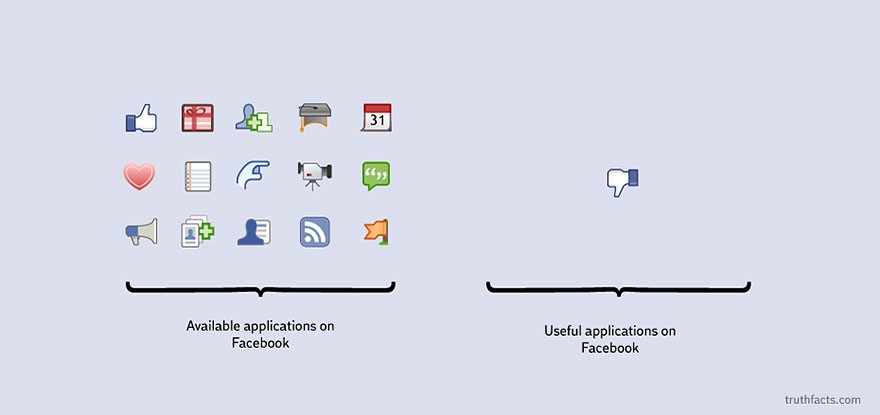
This first graph shows the applications in Facebook that are useful.
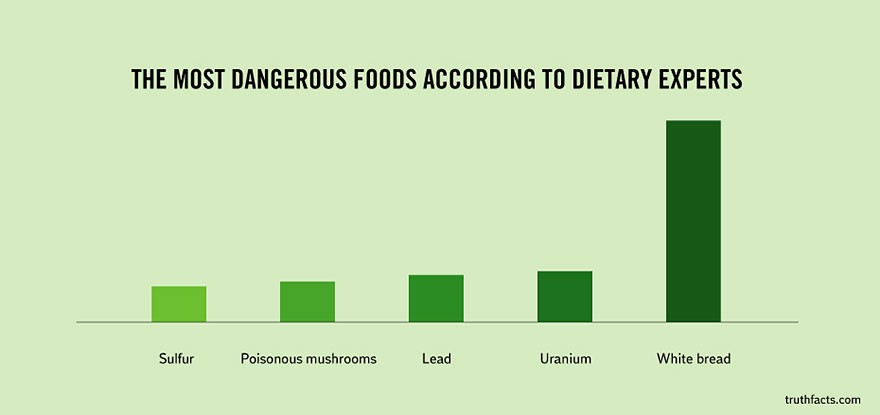
This graph shows the relative danger of foods according to dietary experts (FDA?).
This graph illustrates the nature of content in women’s magazines.


