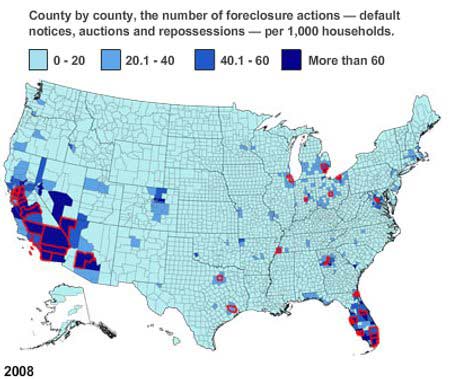
A couple of graphics about the housing issue helps to nicely illustrate what’s happening in our country. The first chart comes courtesy of the MotherJones web site and it shows that just 32 counties (primarily in California, Arizona, Nevada, and Florida) accounted for about 50% of all foreclosures in the United States.
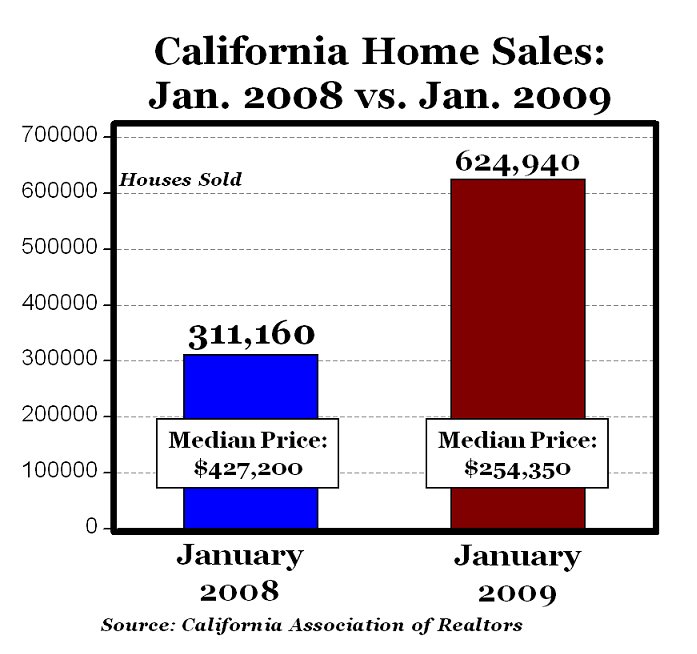
The second graphic shows how home sales in California have doubled since January 2008 — namely because the price of those homes in Cali have dropped by almost 40%.

You now know where the primary source of the financial crisis originated… this should help the limp-wristed Congressman from Taxachusetts on his snipe hunt for the people behind the crisis (Alternatively, SfB could just look in the mirror)